CERN Atlas Experiment

Atlas Great Lakes Tier2 Compute Activity Summary


V14.1_Alt - Sun Jun 16 13:38
U of Michigan Michigan State U       AGL T2
Compact
View
   Doc    other pages:
AGL_T2
MSU_T3

AGLT2 Condor jobs (24h)
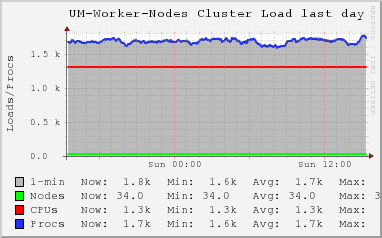
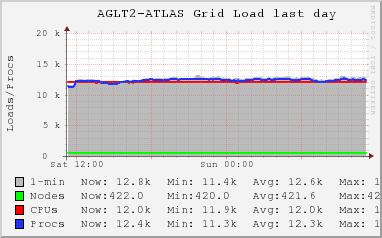
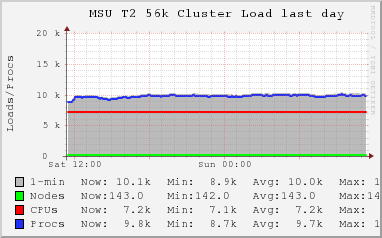
AGLT2 Total Load Summary (24h)
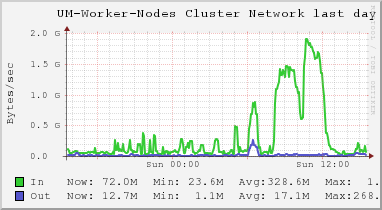
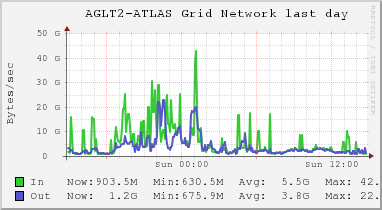
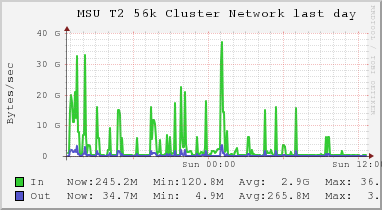
AGLT2 Total Network (24h)
Panglia AGLT2 (24h)
Panglia AGLT2_VHIMEM (24h)
Panglia ANALY_AGLT2_VP (24h)
Panglia AGLT2_MERGE (24h)
Panglia AGLT2_TEST (24h)

MSU Compute Nodes Ganglia
Data Center
Rack 206 Rack 210 Rack 211 Rack 212
-
60. w s h
83. w s h
-
-
93. w s h
86. w s h
-
-
80. w s h
86. w s h
-
-
77. w s h
73. w s h
84. w s h
77. w s h
60. w s h
-
-
59. w s h
-
-
75. w s h
71. w s h
80. w s h
83. w s h
102 w s h
113 w s h
140 w s h
-
-
-
-
-
86. w s h
62. w s h
84. w s h
70. w s h
123 w s h
135 w s h
137 w s h
-
-
32. w s h
-
37. w s h
28. w s h
53. w s h
71. w s h
75. w s h
64. w s h
-
29. w s h
57. w s h
-
36. w s h
62. w s h
67. w s h
-
37. w s h
63. w s h
66. w s h
-
35. w s h
61. w s h
63. w s h
-
33. w s h
62. w s h
61. w s h
-
38. w s h
63. w s h
61. w s h
-
24. w s h
41. w s h
48. w s h
-
33. w s h
55. w s h
50. w s h
-
38. w s h
60. w s h
41. w s h
-
29. w s h
62. w s h
64. w s h
-
38. w s h
63. w s h
55. w s h
-
36. w s h
54. w s h
63. w s h
132 w s h
29. w s h
61. w s h
40. w s h
132 w s h
26. w s h
62. w s h
66. w s h
130 w s h
26. w s h
63. w s h
61. w s h
127 w s h
36. w s h
62. w s h
53. w s h
64. w s h
32. w s h
63. w s h
73. w s h
136 w s h
37. w s h
52. w s h
76. w s h
302 w s h
36. w s h
60. w s h
90. w s h
137 w s h
30. w s h
54. w s h
78. w s h
85. w s h
38. w s h
63. w s h
70. w s h
139 w s h
28. w s h
63. w s h
75. w s h
192 w s h
24. w s h
54. w s h
67. w s h
123 w s h
37. w s h
-
68. w s h
111 w s h
24. w s h
52. w s h
60. w s h
142 w s h
37. w s h
60. w s h
46. w s h
140 w s h
37. w s h
61. w s h
40. w s h
108 w s h
37. w s h
55. w s h
63. w s h
130 w s h
39. w s h
62. w s h
61. w s h
138 w s h
38. w s h
54. w s h
61. w s h
122 w s h
29. w s h
44. w s h
-
114 w s h
7176 Tocal Cores procurable on 143 Compute Nodes at MSU
Current Cumulative load_fifteen 9977 ( 139.0% )
33 nodes load_fifteen(24-cores)
00.00 - 00.85   0.0% idle
00.85 - 12.00   0.0% lightload
12.00 - 22.80   0.0% medium load
22.80 - 43.20   100.0% matched load
43.20 - 52.80   0.0% overloaded
52.80 - 72.00   0.0% trouble?
72.00+   0.0% ouch!
50 nodes load_fifteen(40-cores)
00.00 - 00.85   0.0% idle
00.85 - 20.00   0.0% lightload
20.00 - 38.00   0.0% medium load
38.00 - 72.00   100.0% matched load
72.00 - 88.00   0.0% overloaded
88.00 - 120.00   0.0% trouble?
120.00+   0.0% ouch!
10 nodes load_fifteen(48-cores)
00.00 - 00.85   0.0% idle
00.85 - 24.00   0.0% lightload
24.00 - 45.60   0.0% medium load
45.60 - 86.40   90.0% matched load
86.40 - 105.60   10.0% overloaded
105.60 - 144.00   0.0% trouble?
144.00+   0.0% ouch!
16 nodes load_fifteen(56-cores)
00.00 - 00.85   0.0% idle
00.85 - 28.00   0.0% lightload
28.00 - 53.20   6.2% medium load
53.20 - 100.80   93.8% matched load
100.80 - 123.20   0.0% overloaded
123.20 - 168.00   0.0% trouble?
168.00+   0.0% ouch!
8 nodes load_fifteen(64-cores)
00.00 - 00.85   0.0% idle
00.85 - 32.00   0.0% lightload
32.00 - 60.80   25.0% medium load
60.80 - 115.20   75.0% matched load
115.20 - 140.80   0.0% overloaded
140.80 - 192.00   0.0% trouble?
192.00+   0.0% ouch!
26 nodes load_fifteen(96-cores)
00.00 - 00.85   0.0% idle
00.85 - 48.00   0.0% lightload
48.00 - 91.20   7.7% medium load
91.20 - 172.80   84.6% matched load
172.80 - 211.20   3.8% overloaded
211.20 - 288.00   0.0% trouble?
288.00+   3.8% ouch!
143 nodes w=cpu_wio%
00.00 - 08.00   100.0% low
08.00 - 20.00   0.0% medium
20.00 - 50.00   0.0% high
50.00+   0.0% very high
143 nodes s=cpu_sys%
00.00 - 08.00   99.3% low
08.00 - 20.00   0.7% medium
20.00 - 50.00   0.0% high
50.00+   0.0% very high
143 nodes h=health code
 0    0.0% no info
 1    0.0% script failure
 2    0.0% bulk problem
 3    0.0% network problem
 4    0.0% condor problem
 5    0.0% healthy&ready
 6    100.0% healthy&ON

UMich Compute Nodes (Ganglia)
Row 3 Row 4 Row 5 Randall
Rack 8 Rack 16 Rack 1 Rack 2 Rack 3 Rack 4 Rack 5 Rack 6 Rack 7 Rack 14 Rack 9 Rack 10 Rack 12
                         
                         
          10 d  
11 d
11 d
 
11 d
         
16 d 5 d       10 d            
8 d
76. w s h
      10 d
 
12 d
12 d
12 d
           
8 d
72. w s h
  46 d   10 d            
8 d         10 d        
80. w s h
   
67. w s h
69. w s h
      10 d     46 d  
29. w s h
   
 
73. w s h
               
51. w s h
   
1.4 w s h
                       
8 d            
73. w s h
   
31. w s h
   
              46 d
6.9 w s h
 
50. w s h
  4 d
  6 d  
15 d
 
12 d
15 d
           
47. w s h
 
11 d
11 d
11 d
11 d
   
76. w s h
           
67. w s h
 
   
66. w s h
              33 d  
11 d
11 d
11 d
11 d


16 d
12 d
              33 d  
 
16 d
16 d
16 d
                   
 
11 d
11 d
11 d
 
 
12 d
15 d
15 d
                 
8 d          
66. w s h


8 d
41. w s h
  16 d                  
8 d
42. w s h
  46 d                  
8 d                        
8 d
46. w s h
                     
6 d
 
6 d
6 d
                    24 d  
66. w s h
 
12 d
15 d
12 d
12 d
              16 d  
 
69. w s h
    10 d      
0.2 w s h
  6 d  
 
50. w s h
                  6 d  
  16 d  
1.0 w s h
     
12 d
12 d
12 d
 
      6 d  
  16 d        
12 d
12 d
12 d
12 d
         
                       
        45 d
12 d
 
15 d
 
10 d 10 d          
        45 d 10 d            
       
70. w s h
  10 d 10 d          
 
66. w s h
10 d  
77. w s h
  10 d 10 d          
48. w s h
41. w s h
    33 d   10 d 10 d          
8 d       33 d   10 d 10 d          
1192 Total Cores procurable on 31 Compute Nodes at UMich
Current Cumulative load_fifteen 1634 ( 137.1% )
2 nodes load_fifteen(8-cores)
00.00 - 00.85   0.0% idle
00.85 - 04.00   100.0% lightload
04.00 - 07.60   0.0% medium load
07.60 - 14.40   0.0% matched load
14.40 - 17.60   0.0% overloaded
17.60 - 24.00   0.0% trouble?
24.00+   0.0% ouch!
1 nodes load_fifteen(24-cores)
00.00 - 00.85   100.0% idle
00.85 - 12.00   0.0% lightload
12.00 - 22.80   0.0% medium load
22.80 - 43.20   0.0% matched load
43.20 - 52.80   0.0% overloaded
52.80 - 72.00   0.0% trouble?
72.00+   0.0% ouch!
7 nodes load_fifteen(32-cores)
00.00 - 00.85   0.0% idle
00.85 - 16.00   0.0% lightload
16.00 - 30.40   14.3% medium load
30.40 - 57.60   71.4% matched load
57.60 - 70.40   14.3% overloaded
70.40 - 96.00   0.0% trouble?
96.00+   0.0% ouch!
10 nodes load_fifteen(40-cores)
00.00 - 00.85   0.0% idle
00.85 - 20.00   0.0% lightload
20.00 - 38.00   0.0% medium load
38.00 - 72.00   90.0% matched load
72.00 - 88.00   10.0% overloaded
88.00 - 120.00   0.0% trouble?
120.00+   0.0% ouch!
11 nodes load_fifteen(48-cores)
00.00 - 00.85   0.0% idle
00.85 - 24.00   9.1% lightload
24.00 - 45.60   0.0% medium load
45.60 - 86.40   90.9% matched load
86.40 - 105.60   0.0% overloaded
105.60 - 144.00   0.0% trouble?
144.00+   0.0% ouch!
0 nodes load_fifteen(56-cores)
00.00 - 00.85 idle
00.85 - 28.00 lightload
28.00 - 53.20 medium load
53.20 - 100.80 matched load
100.80 - 123.20 overloaded
123.20 - 168.00 trouble?
168.00+ ouch!
0 nodes load_fifteen(64-cores)
00.00 - 00.85 idle
00.85 - 32.00 lightload
32.00 - 60.80 medium load
60.80 - 115.20 matched load
115.20 - 140.80 overloaded
140.80 - 192.00 trouble?
192.00+ ouch!
0 nodes load_fifteen(80-cores)
00.00 - 00.85 idle
00.85 - 40.00 lightload
40.00 - 76.00 medium load
76.00 - 144.00 matched load
144.00 - 176.00 overloaded
176.00 - 240.00 trouble?
240.00+ ouch!
0 nodes load_fifteen(96-cores)
00.00 - 00.85 idle
00.85 - 48.00 lightload
48.00 - 91.20 medium load
91.20 - 172.80 matched load
172.80 - 211.20 overloaded
211.20 - 288.00 trouble?
288.00+ ouch!
31 nodes w=cpu_wio%
00.00 - 08.00   100.0% low
08.00 - 20.00   0.0% medium
20.00 - 50.00   0.0% high
50.00+   0.0% very high
31 nodes s=cpu_sys%
00.00 - 08.00   100.0% low
08.00 - 20.00   0.0% medium
20.00 - 50.00   0.0% high
50.00+   0.0% very high
31 nodes h=health code
 0    0.0% no info
 1    0.0% script failure
 2    12.9% bulk problem
 3    0.0% network problem
 4    0.0% condor problem
 5    0.0% healthy&ready
 6    87.1% healthy&ON